Story Points - a mathematical perspective
March 28, 2020
In sprint planning meetings, The Development Team works to forecast the functionality that will be developed during the Sprint. This often involves estimating the effort required to complete work on user stories. Story points are an abstract measure of the effort required to complete a story, and it’s fascinating to me how a set of educated guesses turns out to be a fairly accurate estimate of the effort required to meet sprint goals. Planning poker or some variant of it makes the whole exercise seem somewhat arbitrary. But it works well in the end.
Product owners want estimates to be as accurate as possible. It helps them set their timelines of delivery, make commitments to the stake holders, and make decisions that affect the project and possibly the entire business.
An accurate estimate! Do you see something weird going on here?
According to Cambridge Dictionary, an estimate is a guess of what the size, value, amount, cost, etc. of something might be. Note that it is just a guess. There is no guarantee that your story points estimate represents true effort you would eventually require to complete the user story. It can be accurate if you are lucky though.
But then, how can we rely on a series of story points – which are really a set of estimates – for planning and decision-making purposes? If each estimate is potentially wrong, then how do we deal with the accumulated error of estimation for an entire sprint plan?
At this point, statistics comes to our help.
Statisticians tell us about something called a “normal distribution”. It is a distribution that occurs naturally in many situations. A quick google shows that this distribution is applicable in following scenarios:
- Heights of people
- Blood pressure
- Points on a test
- IQ scores
- Salaries
- Measurement errors
The last application in this list is of interest to us. I would argue that in case of story points estimation, our error in estimation would follow normal distribution, or something very close to it.
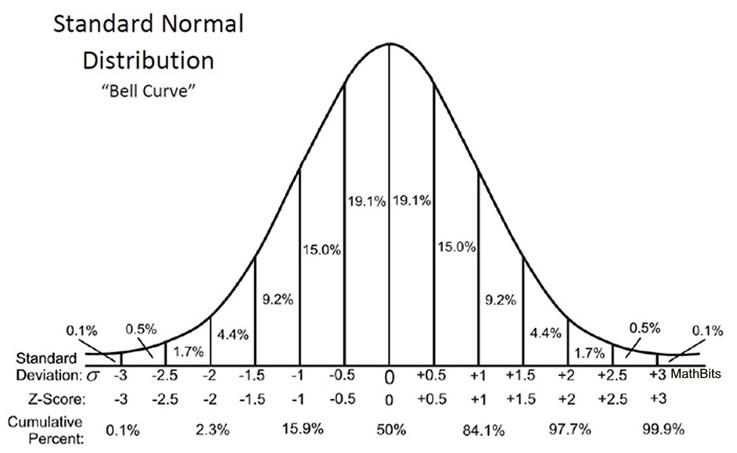
So, what does that mean?
Note that this curve is symmetric. It’s reasonable to assume that the number of times I overestimate the effort required to complete a story (or the amount by which I overestimate some stories) will be roughly equal to the number of times I underestimate the effort (or the amount by which I underestimate). With this mathematical intuition, I think it’s safe to assume that the overestimates will cancel the underestimates over many sprints!
And this shows why story points work nicely for planning purposes.
A consequence of this perspective is that there is no need to read too much into how many story-points a team has completed in any given sprint. Many factors might have affected a single sprint. The real value, from a planning perspective, is in the averages; for example, average story points completed in, say, last 5 sprints.
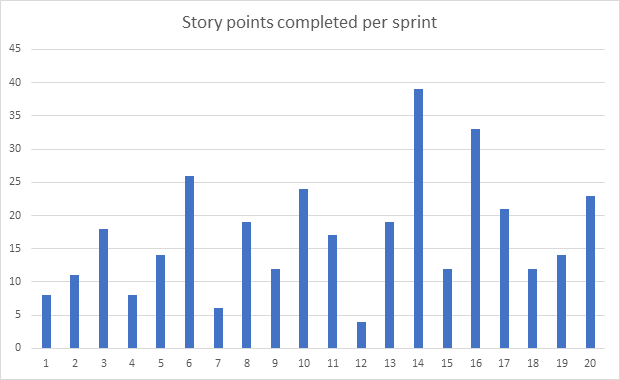
The above graph shows story points in an actual project I was recently involved in. The lumpiness of this graph makes us feel that something is not quite right here. But the situation makes more sense if we consider the averages over 5 sprints.
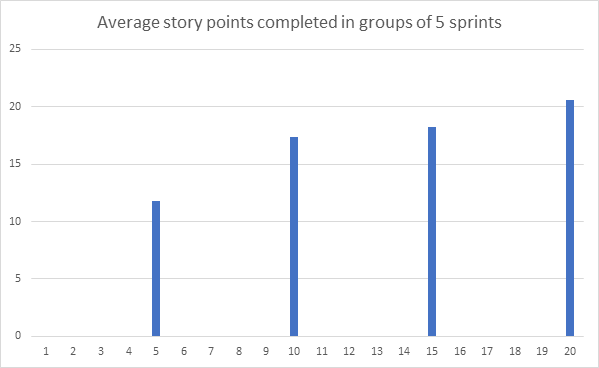
This graph shows the progress the same team made as the project progressed during the first 4 months or so. After a rather slow start the team did gain some momentum.
As long as we are able to identify the reasons of lumpiness in any given pair of two consecutive sprints, I think we should be reasonably happy with this sort of progress. The longer-term trends showing the averages are better representatives of the progress a Scrum team makes during the course of a project.
So, this is what I propose. Next time when somebody passionately defends their estimate during a sprint planning meeting, just give up. Make them happy by acknowledging their estimate as the correct one (within reason, of course), and take comfort in the fact that even if their estimate is wrong in your judgment, normal distribution will take care of errors of estimation in the long run.